< Transportation Infrastructure Intelligence >
Drone inspection for bridges, rail, roads and transport corridors.
< 01 / Overview >
Drone Surveys & Data Intelligence For Transport Infrastructure.

< 02 / Sector challenges >
Transport infrastructure challenges.

Ageing Asset Inventory
Bridge and road networks age while traffic volumes increase. Deterioration accelerates. Maintenance backlogs grow. Traditional inspection cycles can't keep pace with condition changes.

Inspection Methods Inadequate
Rope access is dangerous and slow. Scaffolding is prohibitively expensive. Cherry pickers have limited reach and require lane closures. Manual inspections suffer from subjective assessments and inconsistent documentation.

Budget Constraints
Maintenance budgets tighten while infrastructure ages. Must prioritise spending on highest-risk assets. Need accurate condition data to optimise maintenance decisions and justify budget requests.

Traffic Disruption
Lane closures for inspection cause congestion and economic impact. Public frustration with recurring closures. Pressure to minimise disruption while maintaining thorough inspection programmes.
< 03 / oPERATIONAL APPLICATIONS >
Intelligence for every transport asset.

Bridge Inspection & Monitoring
- Deck surface defects (cracking, spalling, delamination)
- Piers, abutments, bearings and joints condition
- Beams, girders and superstructure integrity
- Cable, suspension and anchorage condition

Rail Infrastructure
- Track corridor clearance, drainage and stability
- Station platforms, buildings and accessibility
- Overhead electrification and support structures
- Tunnel lining, water ingress and systems

Highway & Road Networks
- Pavement distress and degradation tracking
- Signs, barriers, lighting and road furniture
- Drainage assets, culverts and erosion risks
- Construction and roadworks compliance

Airport Infrastructure
- Runway and taxiway surface condition
- FOD detection and pavement markings
- Perimeter security and wildlife risks
- Terminal buildings and critical facilities

Port & Maritime Infrastructure
- Docks, wharves and fendering systems
- Yard usage, surfaces and asset tracking
- Cranes, rails and handling equipment


< 04 / How it works >
Our approach.
Plan
Routes, safety perimeters and data objectives agreed with operators across linear assets, from motorways to rail corridors.
Capture
Long-range, repeatable missions flown under advanced CAA permissions and BVLOS-VM, with optical, LiDAR and thermal payloads capturing georeferenced data across embankments, bridges, drainage and track infrastructure.
Process
Data is encrypted and processed within the StirlingX platform, producing high-fidelity maps, 3D models and digital twins.
Analyse
Advanced analytics detect defects, vegetation encroachment, surface degradation and environmental risks, supporting predictive maintenance and planning.
Report
Findings are consolidated across sites and routes into a network-level view, giving asset teams what they need for intervention decisions and capital planning.
< Outputs >
What you receive.
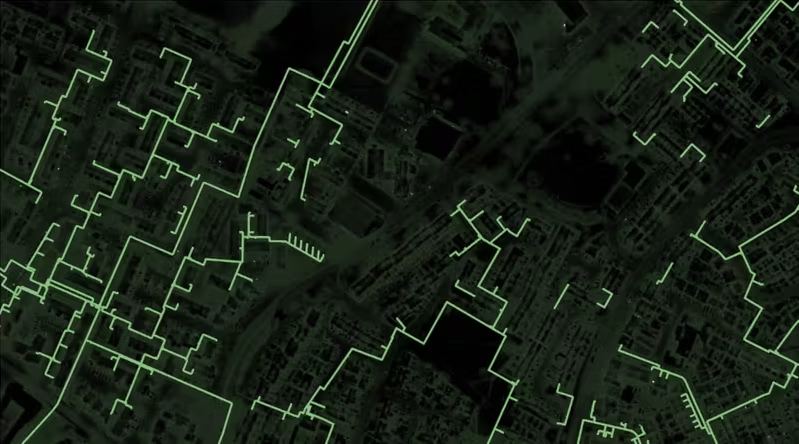
Transport operators and asset owners receive a secure, cloud-based analytics environment that turns infrastructure and corridor data into clear, decision-ready outputs - accessible to engineering, operations, commercial, and executive teams.
01
Interactive Asset Intelligence Dashboard
02
High-Resolution Visual Records
03
Survey-Grade Infrastructure Data
04
Condition, Quantity, and Compliance Reports
< Benefits >
Results for transport authorities and operators.

Safety Enhancement
- Earlier detection of structural deficiencies prevents failures
- Reduced inspector exposure to traffic and high-risk locations
- Proactive intervention prevents service disruptions
- Full documentation supports safety programmes

Cost Optimisation
- Eliminate the need for expensive access equipment, such as scaffolding and mobile elevated work platforms
- Reduced traffic control costs and lane closure requirements
- Optimised maintenance through condition-based prioritisation
- Better budget forecasting from accurate condition trending

Operational Efficiency
- Faster inspections without traffic closures or disruptions
- Inspect more assets in less time with consistent quality
- Running several sites at once shortens the programme
- Reduced public inconvenience from inspection activities

Asset Longevity
- Early intervention extends infrastructure life
- Better understanding of degradation mechanisms
- Data-driven capital planning and programming
- Maximum return on maintenance investment
< Case Studies >
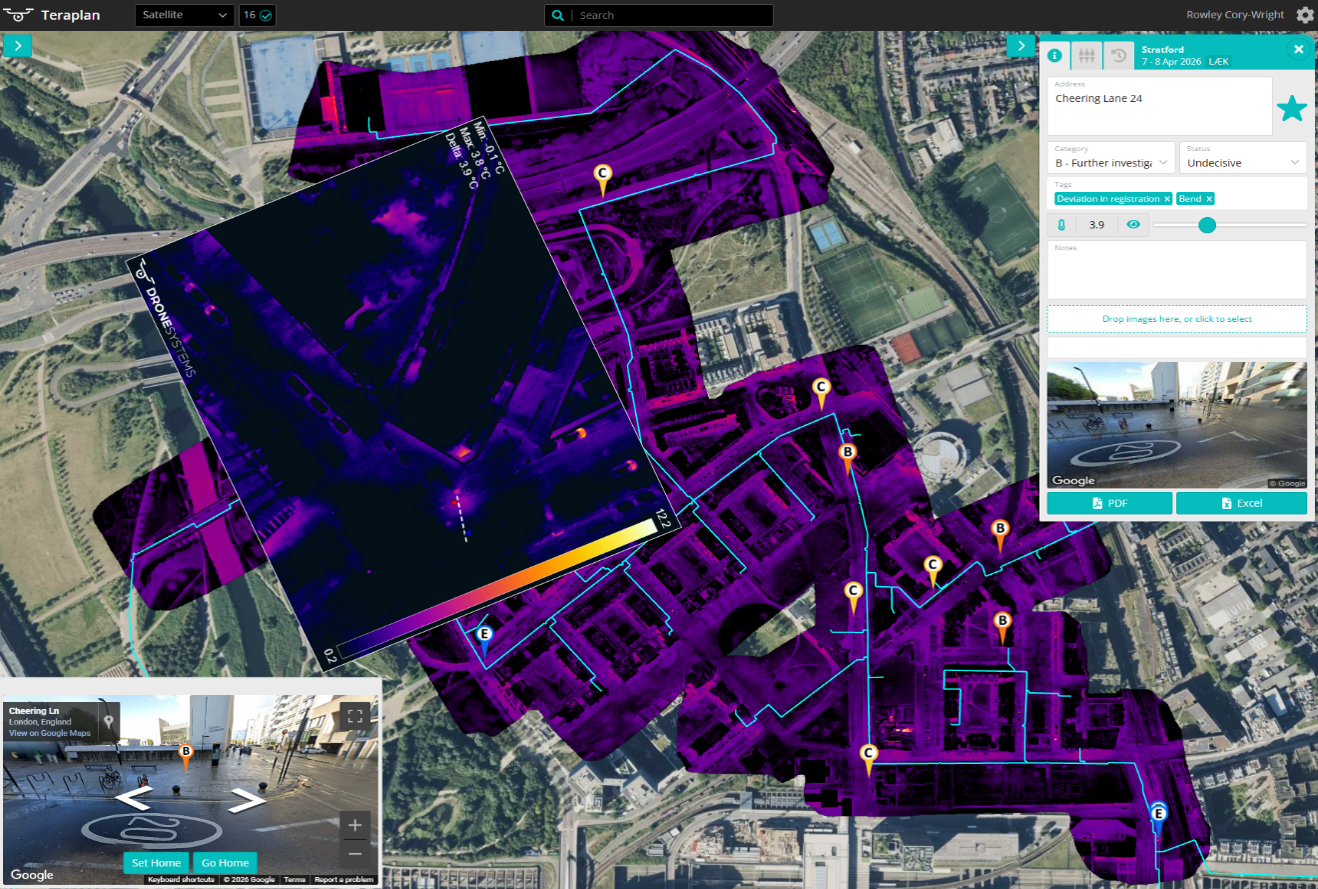
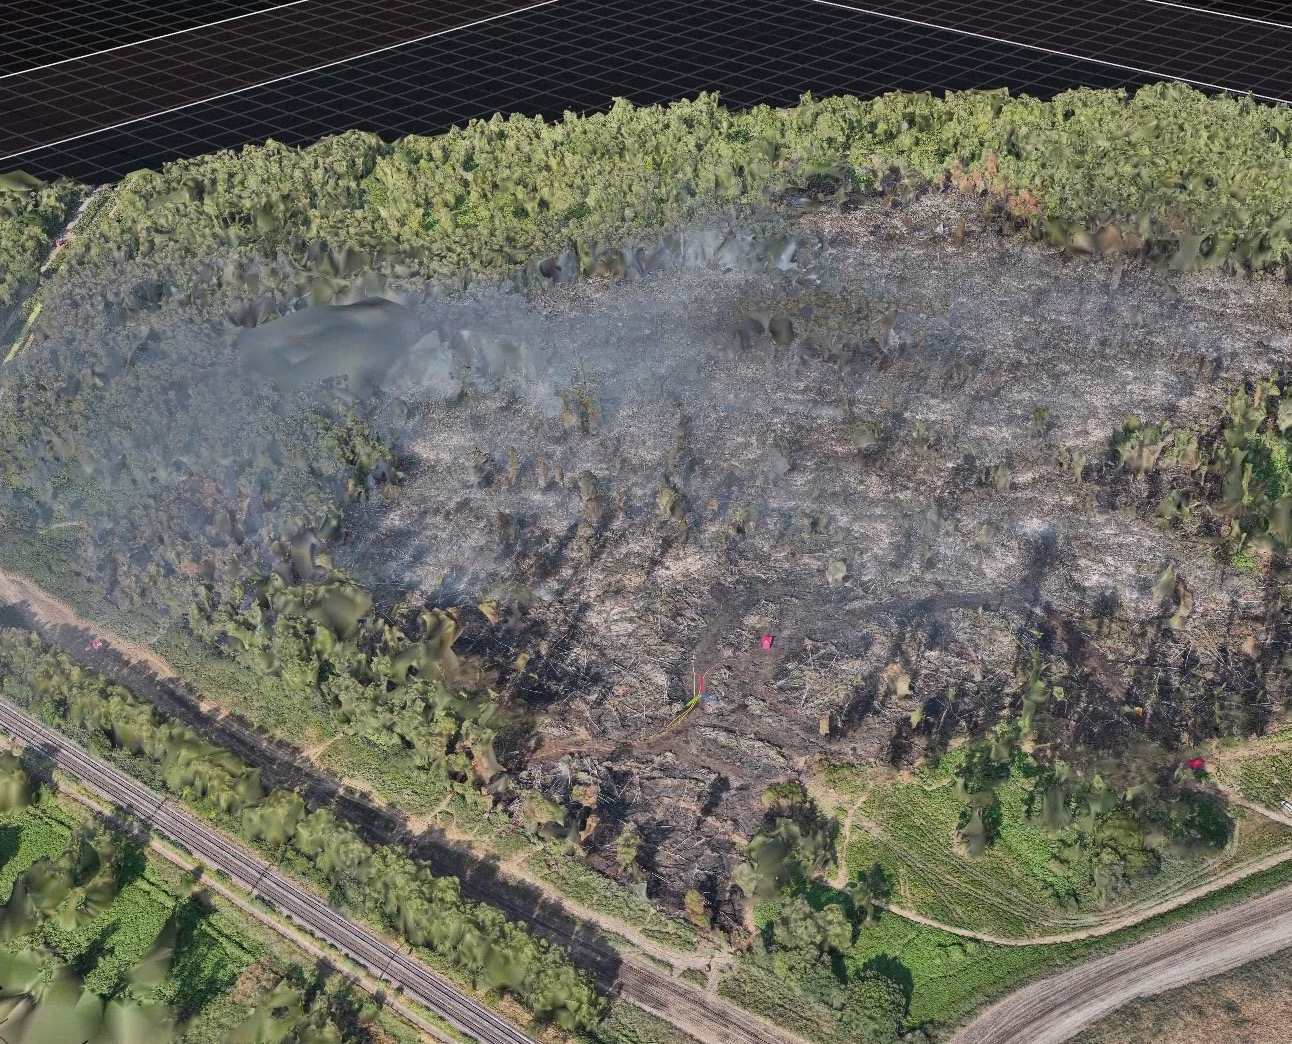
What we've accomplished. Real solutions from real projects.

.png)
Find answers about how StirlingX works and what to expect.
Need more information? Reach out to discuss your specific situation.

Can you operate without closing bridges or roads?
What accuracy do you achieve for crack and defect measurements?
Can you support emergency assessments after incidents?
How does data integrate with our asset management system?
Modernise Your Infrastructure Monitoring.
Learn how continuous project intelligence improves outcomes and protects your infrastructure.